How to Do Marketing Reporting Right
Well-handled reporting is the key to evaluating your marketing activities. How should you interpret the data, and what should you watch out for?

Marketing reporting is the most important part of your online business. You can have the best agencies or specialists, but without a clear view of the results, you can’t assess what your marketing activities are bringing in or make the key decisions that lead to your business’s growth – or its downfall.
A marketing report can take many forms and contain all kinds of information – from a written assessment of the overall situation and an overview of the work done, all the way to the most important part: the actual campaign results. Today’s systems let us connect data from all ad platforms and tools such as Google Analytics or Google Search Console fairly accurately and easily, and then visualize it in another tool. At 4Bros, we most often use Looker Studio or spreadsheets.
Before Building a Marketing Report, Keep 3 Key Factors in Mind
Everybody Lies
Even though these days we can track every click or scroll on your website, probably no marketer would swear that a platform’s results are 100% accurate.
Meta, Google Ads, Sklik (the ad platform of the Czech search engine Seznam), Heureka… all these platforms live off the money you invest in ads. So they subtly try to show you that this or that platform is the one that matters most to you – and every now and then they claim a conversion or two for themselves. If we wanted to go really deep, we’d get to attribution models, which describe how a given system works and when it credits itself with a conversion. The problem arises when you find out that every platform uses a different model, and several platforms can claim the same conversion at once. Duplicate conversions can then really mess with your results. And you’re left scratching your head over why each platform shows great performance while Google Analytics is glowing red.

Watch Out for Tracking Errors
It can also easily happen that your website code gets changed and suddenly the platforms’ JavaScript tags stop tracking. You’ll be staring at empty tables while your charts drop to zero. That’s why we’d take the old saying “measure twice, cut once” to heart.

Decide What You Want to Evaluate
When reading the data, you need to define the metrics you want to focus on when analyzing your marketing activities. Then it’s important to make sure your campaigns are set up to deliver the metrics you’re after.
Here are a few examples we’ve come across in the past that led to wrong decisions.
- Traffic campaigns: If you use this popular campaign type, designed to bring very cheap traffic to your website, you need to look at cost per click (CPC). Metrics such as conversion rate or PNO (cost-to-revenue ratio) aren’t that relevant here.
- YouTube video campaigns: Another very popular campaign type, used to build brand awareness. With YouTube campaigns, it’s often true that they won’t drive much revenue. What you’re primarily interested in is reach, frequency and view duration. It also depends on the video format and campaign type. There are exceptions where campaigns can drive conversions, but then they don’t fulfill brand goals.
- Shopping campaigns: Here we don’t see misinterpretation that often. These are purely performance campaigns, and they’re exactly where we care most about revenue, orders and PNO.
Beyond individual campaigns, you need to consider which part of the marketing funnel and the customer’s conversion path your ads appear in – and evaluate them accordingly.
Building a Performance Report
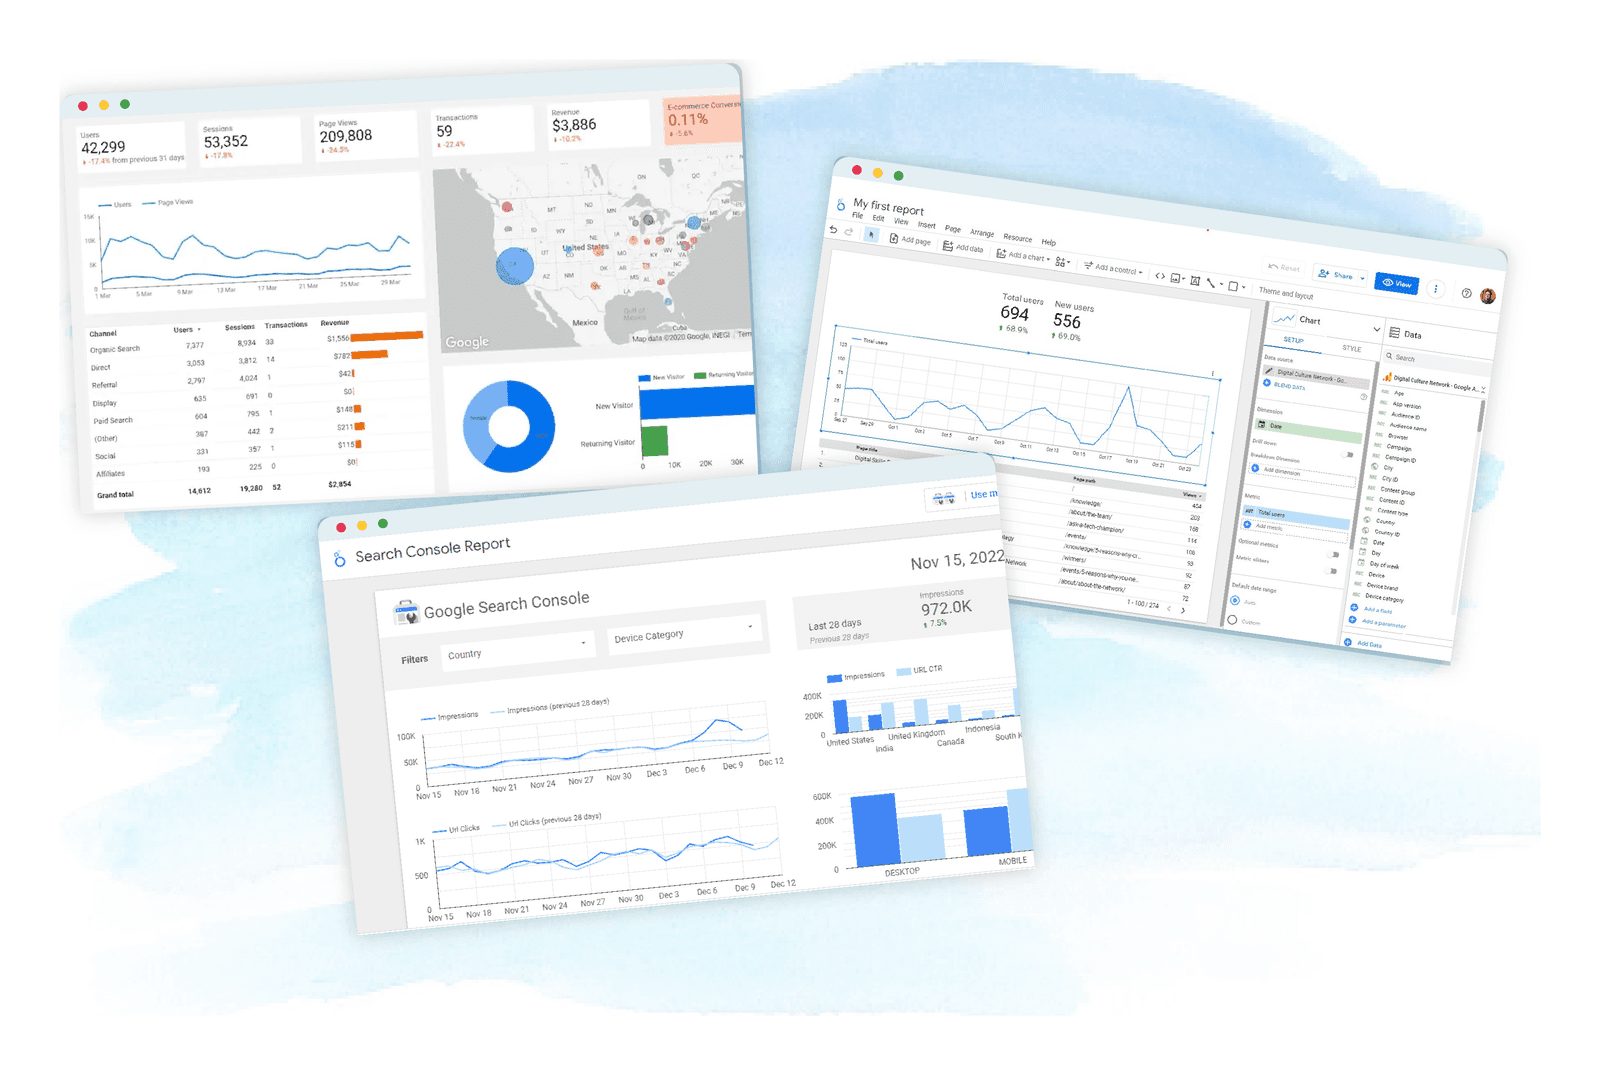
Let’s talk about what a marketing report should look like. At 4Bros, efficiency is key. That’s why we don’t like a confusing jumble of tables and unrelated charts. We build our reports so that within 10 minutes of opening one, we can assess the client’s overall situation. Even on the way to work, or as a quick update before a meeting. For that, we use the overview page in Looker Studio.
Overview
It’s a simple summary where, for an online store, we see overall PNO, revenue and costs. Using Supermetrics, we bring these metrics together into two charts: one shows a daily overview, the other a month-on-month comparison.
We calculate overall PNO from revenue pulled directly from the website admin (so it’s very accurate), and add up all marketing costs. That gives us a clear view of whether we’re hitting our KPIs or not, and whether there have been any major fluctuations recently.
Platform-Specific Sheets
After the overview comes a more detailed breakdown by platform. These sheets are built primarily for specialists optimizing campaigns. They show how individual campaigns, creatives or even specific keywords are meeting their goals. The breakdown goes into great detail and is key for us to make the right decisions – based on data, not gut feeling. Even though the sheet is detailed and packed with information, it’s still very easy to read. That saves us time during optimization while giving a quick overview of each platform.

That was a quick summary of what your marketing report shouldn’t miss and what reporting looks like at 4Bros. Our goal is to present marketing data clearly, transparently and as accurately as possible, taking into account each platform’s attribution models and their shortcomings.